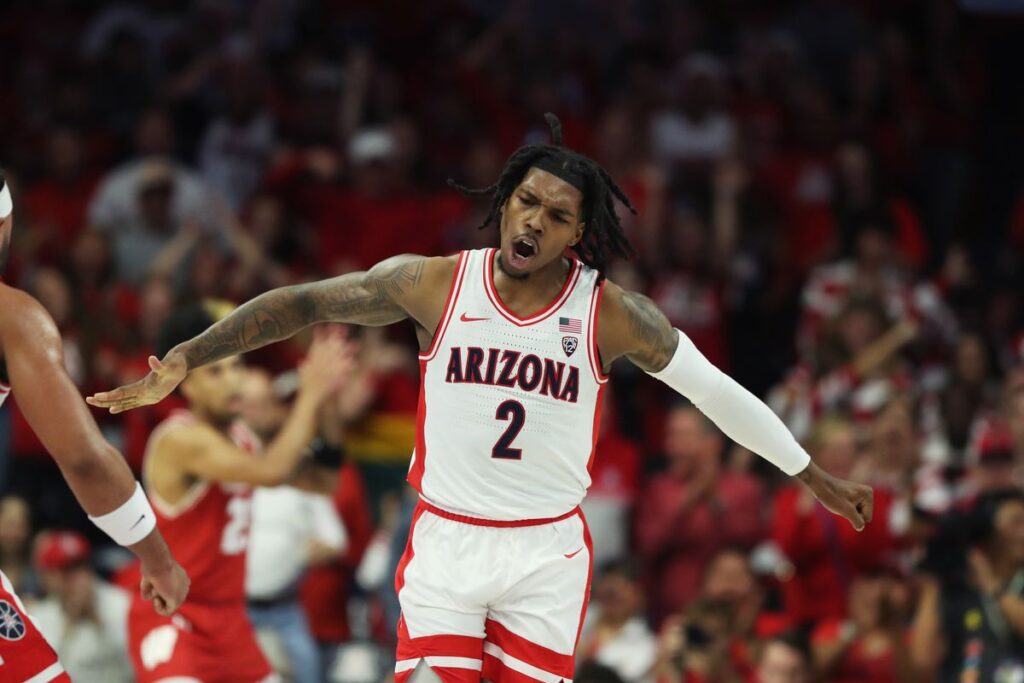
The best part of the college basketball season is on the horizon and the closer it gets, the more excitement builds. NCAA March Madness kicks off on March 19th and in light of that, brackets are starting to roll out. As always, the most emphasis from both a bracket and betting standpoint, is trying to predict the eventual champion.
To do this effectively, it’s important to understand NCAA tournament past trends. When doing so, it unveils a similar set of characteristics which can help be a predictor of potential team success in March Madness.
Before we dive into these common characteristics, it’s important to highlight that while these tools are useful in assisting to predict possible success, they are by no means the only metrics that can be used and definitely don’t guarantee success.
Early Season Ranking
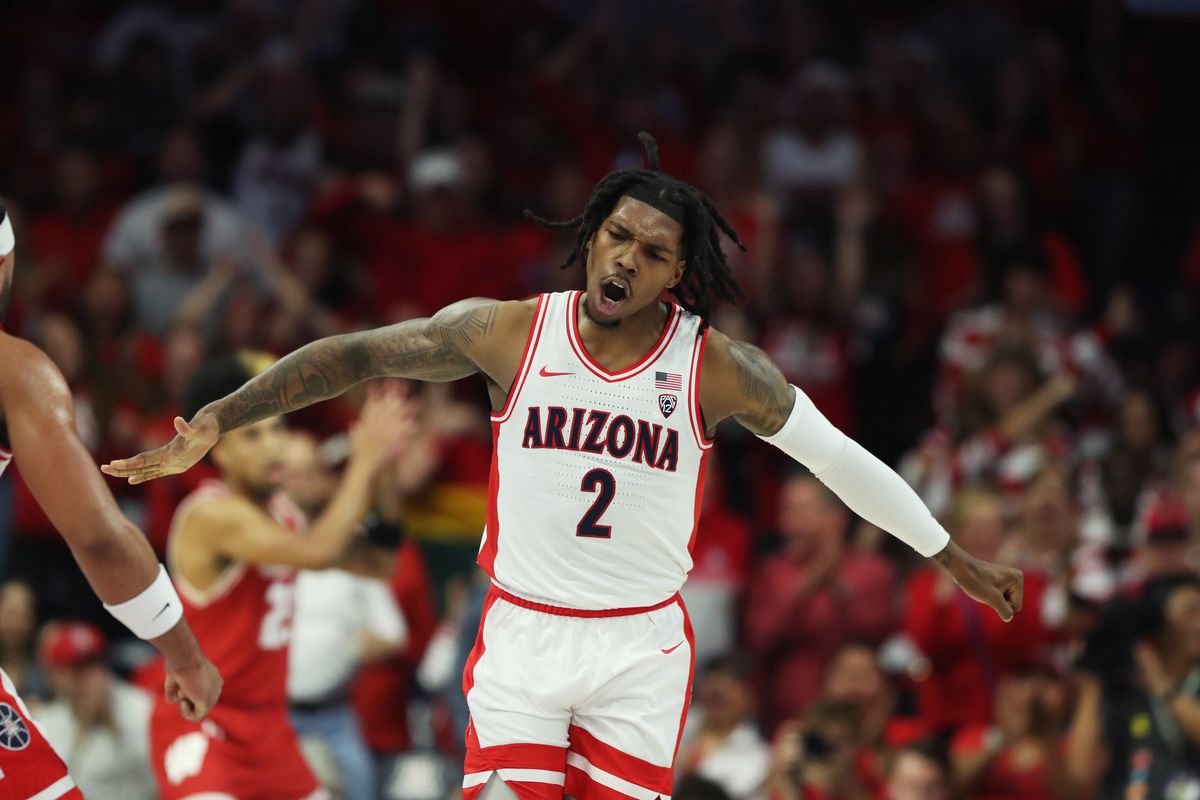
This metric is definitely more of an arbitrary one, but worth noting nonetheless. 100% of the National Champions in the last twenty years have been in the top twelve in the AP poll in week six of the college basketball season.
At Week Six, this is what the AP Poll rankings looked like:
- Arizona
- Kansas
- Purdue
- Houston
- Uconn
- Baylor
- Marquette
- Creighton
- North Carolina
- Gonzaga
- Oklahoma
- Tennessee
It’s hard to pinpoint exactly why this metric has ended up being a critical component of champions, but one aspect is it reflects team records post non-conference play. These rankings roughly come out a week or so before conference play begins in NCAA and non-conference play is widely acknowledged to be more reflective of the March Madness environment. Teams have less familiarity and therefore less data to evaluate previous matchups and game plans.
A Balanced Output

The phrase, ‘defence wins championships’ gets utilised a lot and while defence is clearly integral to a teams success, it’s important not to overlook offensive output as a critical metric in determining success. Just two of the past twenty one champions entering the tournament have had an adjusted offence ranked outside the top twenty. As a result, placing emphasis on both adjusted defence and offence is important. Taking the first metric into consideration (Top 12 AP Week 6 Ranking) and then applying the ADJO and ADJD stats generates the following:
- Arizona (ADJO: 6, ADJD: 11)
- Kansas (ADJO: 47, ADJD: 6)
- Purdue (ADJO: 2, ADJD: 20)
- Houston (ADJO: 16, ADJD: 1)
- Uconn (ADJO: 3, ADJD: 23)
- Baylor (ADJO: 4, ADJD: 85)
- Marquette (ADJO: 23, ADJD: 16)
- Creighton (ADJO: 9, ADJD: 24)
- North Carolina (ADJO: 18, ADJD: 10)
- Gonzaga (ADJO: 14, ADJD: 52)
- Oklahoma (ADJO: 73, ADJD: 21)
- Tennessee (ADJO: 19, ADJD: 5)
Taking the teams that register a top 20 ADJO and ADJD is a safe way to identify the teams that have a balanced team. In doing so, that leaves just Arizona, Purdue, Houston, North Carolina and Tennessee.
They Take Care Of The Ball
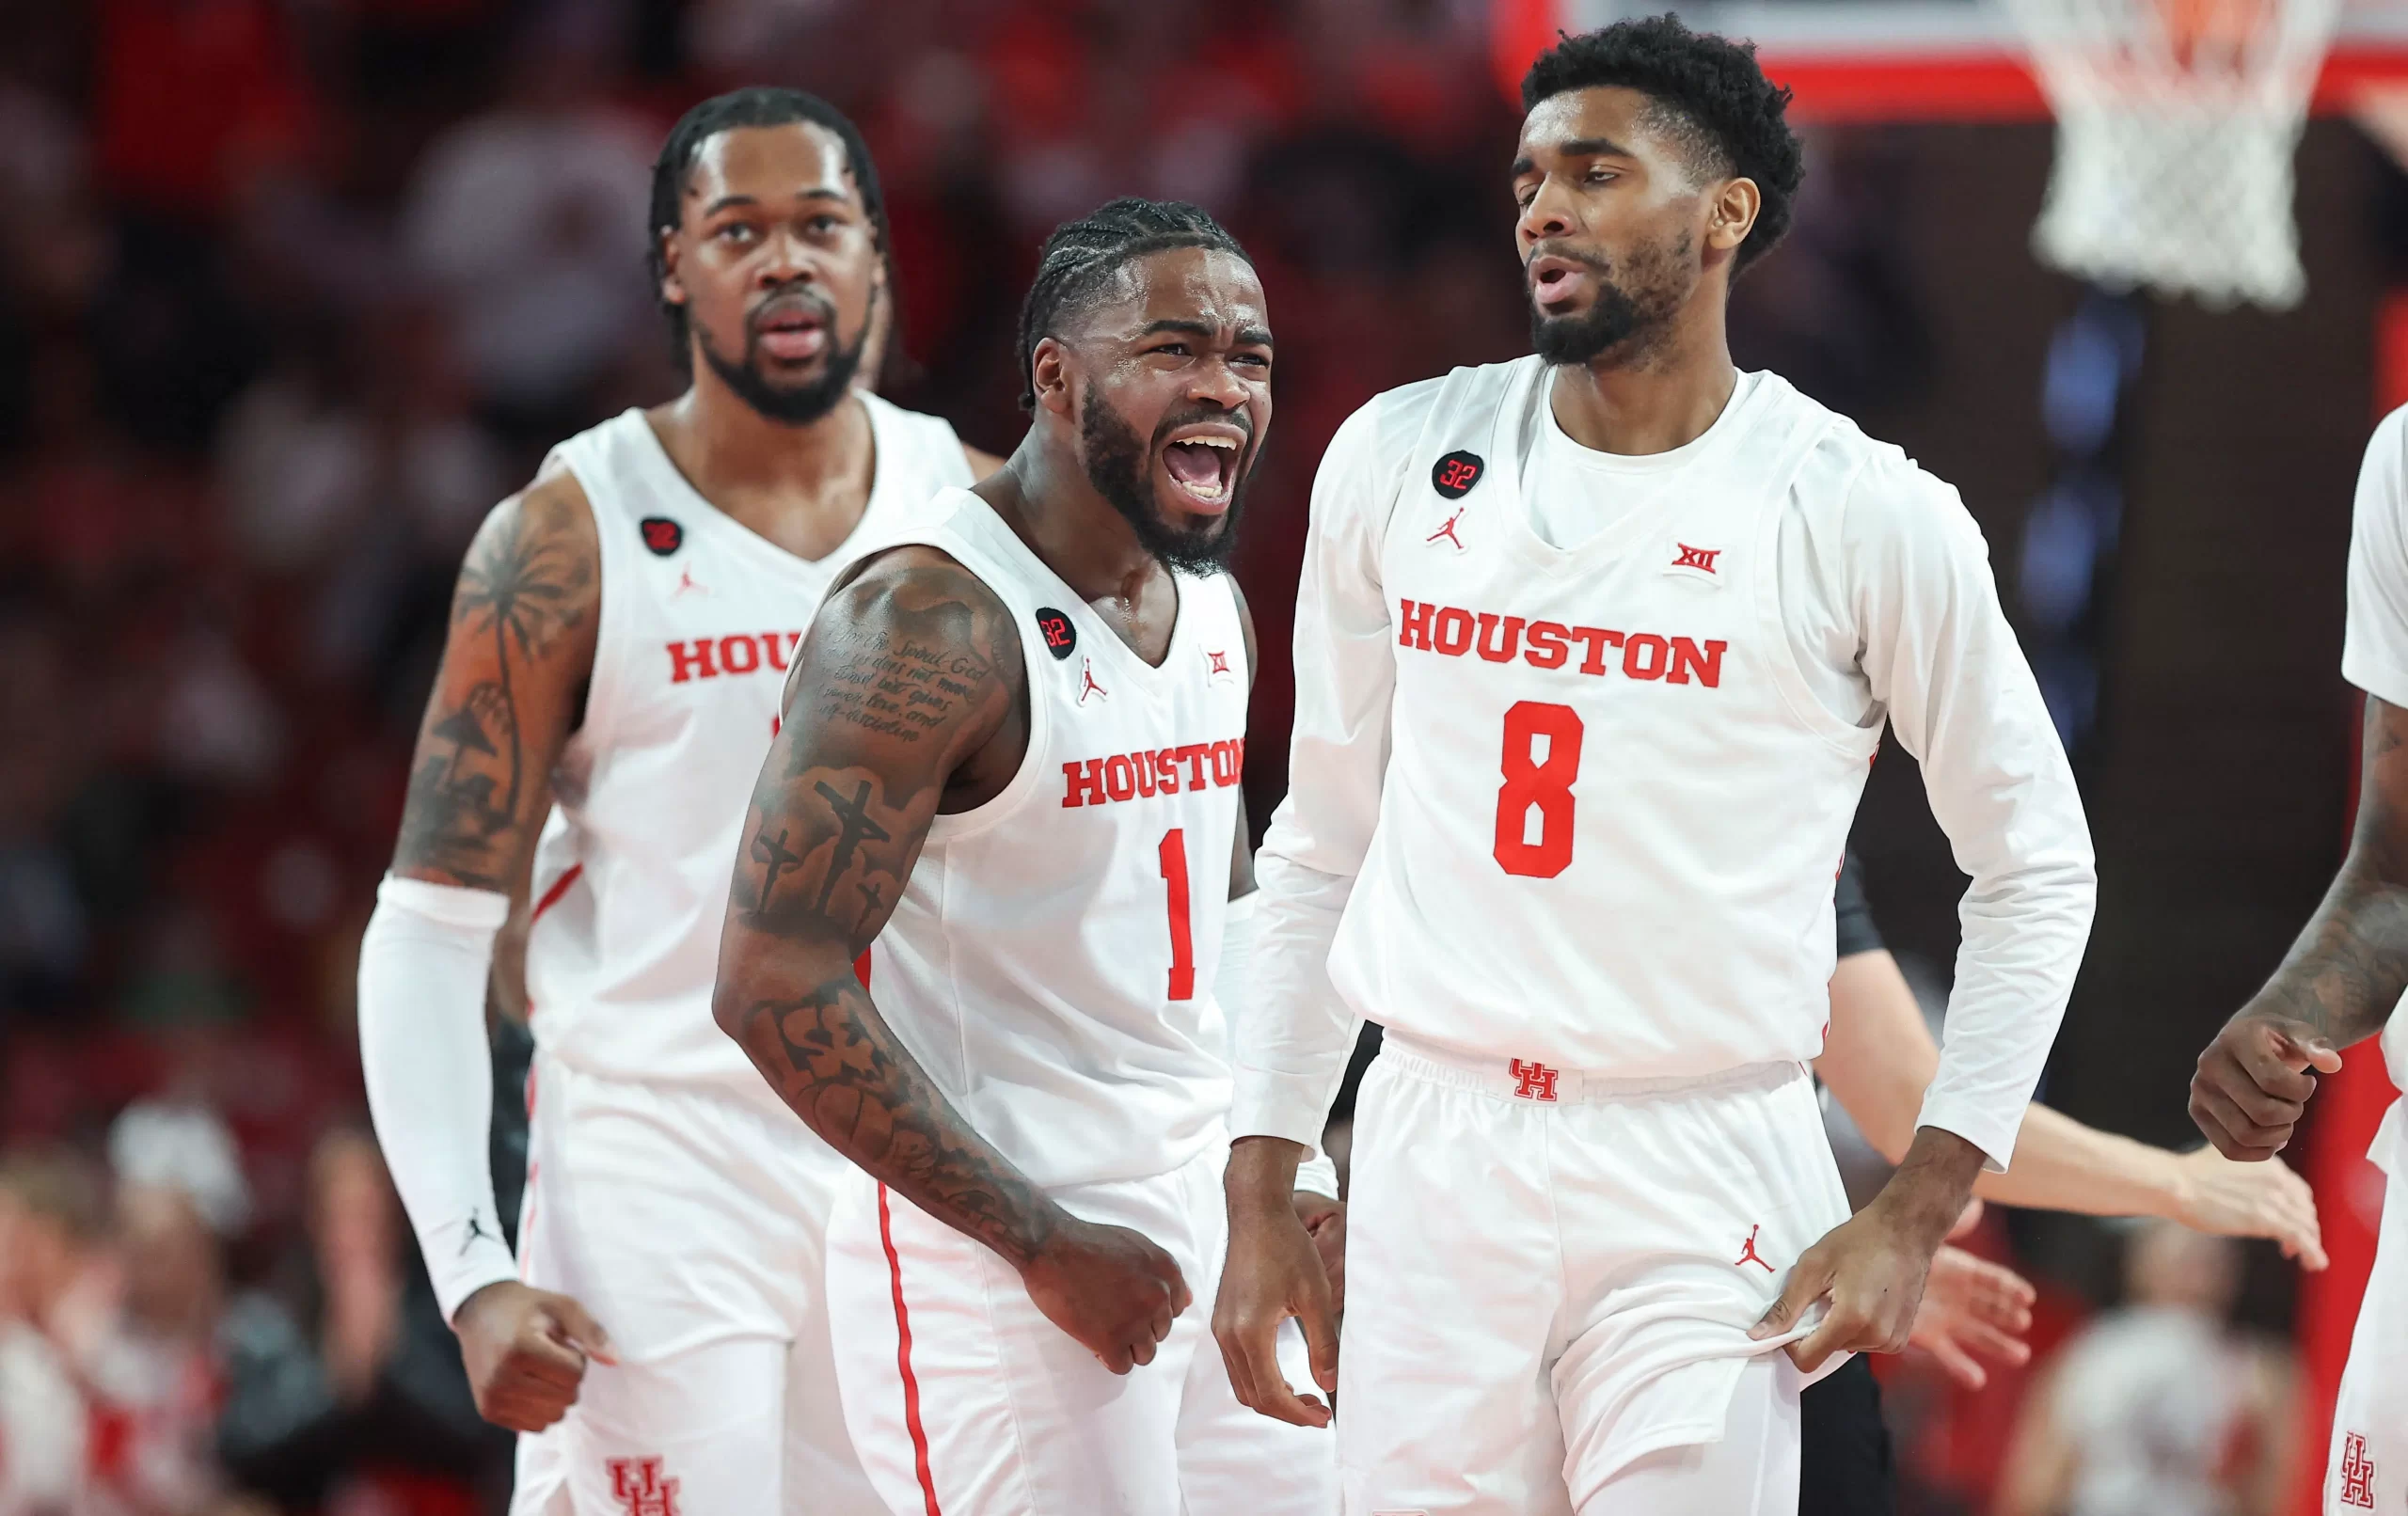
It doesn’t take rocket science to understand why this is important. Clearly teams that commit less offensive turnovers more opportunities to convert possessions into made baskets. Of the 68 Final Four teams since 2002, 47 (69%) finished their season (including March Madness) with an offensive turnover rate ranked inside the top 100.
With the remaining teams in this list:
Houston (10.9%, 2nd lowest)
North Carolina (12.3%, 19th lowest)
Tennessee (12.5%, 25th lowest)
Arizona (13.1%, 52nd lowest)
Purdue (14%, 116th lowest)
The first metric is rather constrictive and is definitely more arbitrary as previously mentioned. If you don’t want to apply that, there are a few other interesting metrics that can be delved into which broaden the potential pool.
Some other interesting metrics I’ll be considering include:
Leaning On Their Best Rotations Come Tournament:
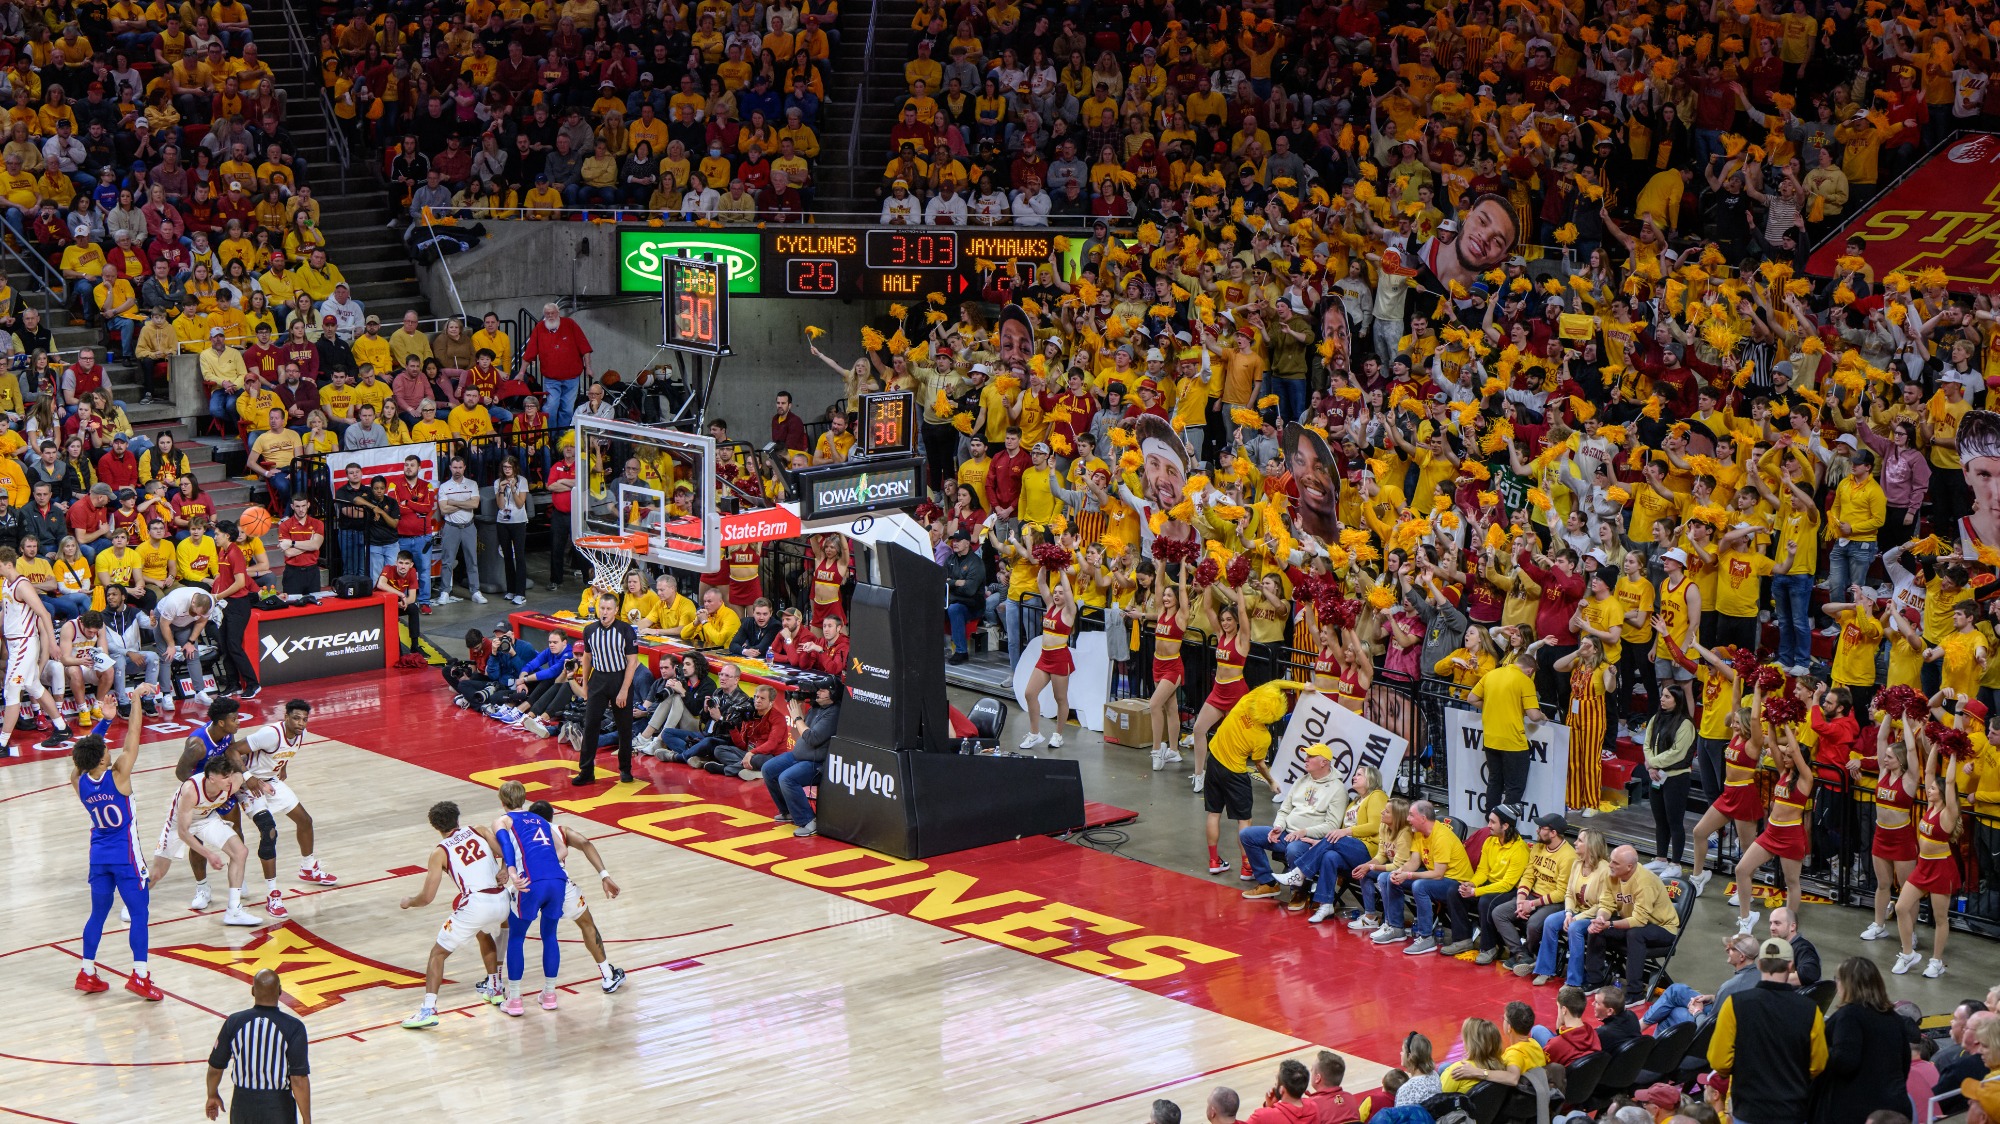
Collin Wilson (@_Collin1) dug up some really interesting metrics surrounding three man lineups. Obviously throughout the season, coaches are more likely to lean on deeper rosters to help manage fatigue. However, come tournament time, when it comes to crunch time, the ability to lean on your best rotation is incredibly important.
When evaluating potential March Madness dark horses, this has proven to be a strong indicator. In 2022 it was North Carolina, while in 2023, FAU and SDS were the unexpected overachievers. In 2022, NC accounted for 8/100 top three player lineups, while last year, FAU and SDS accounted for 7/100. This season, “there are 5,689 three player lineup combinations in Division I basketball. Houston and Iowa State account for 22 of the top 100 in terms of Adjusted Team Efficiency Margin”.
Coaching Staff
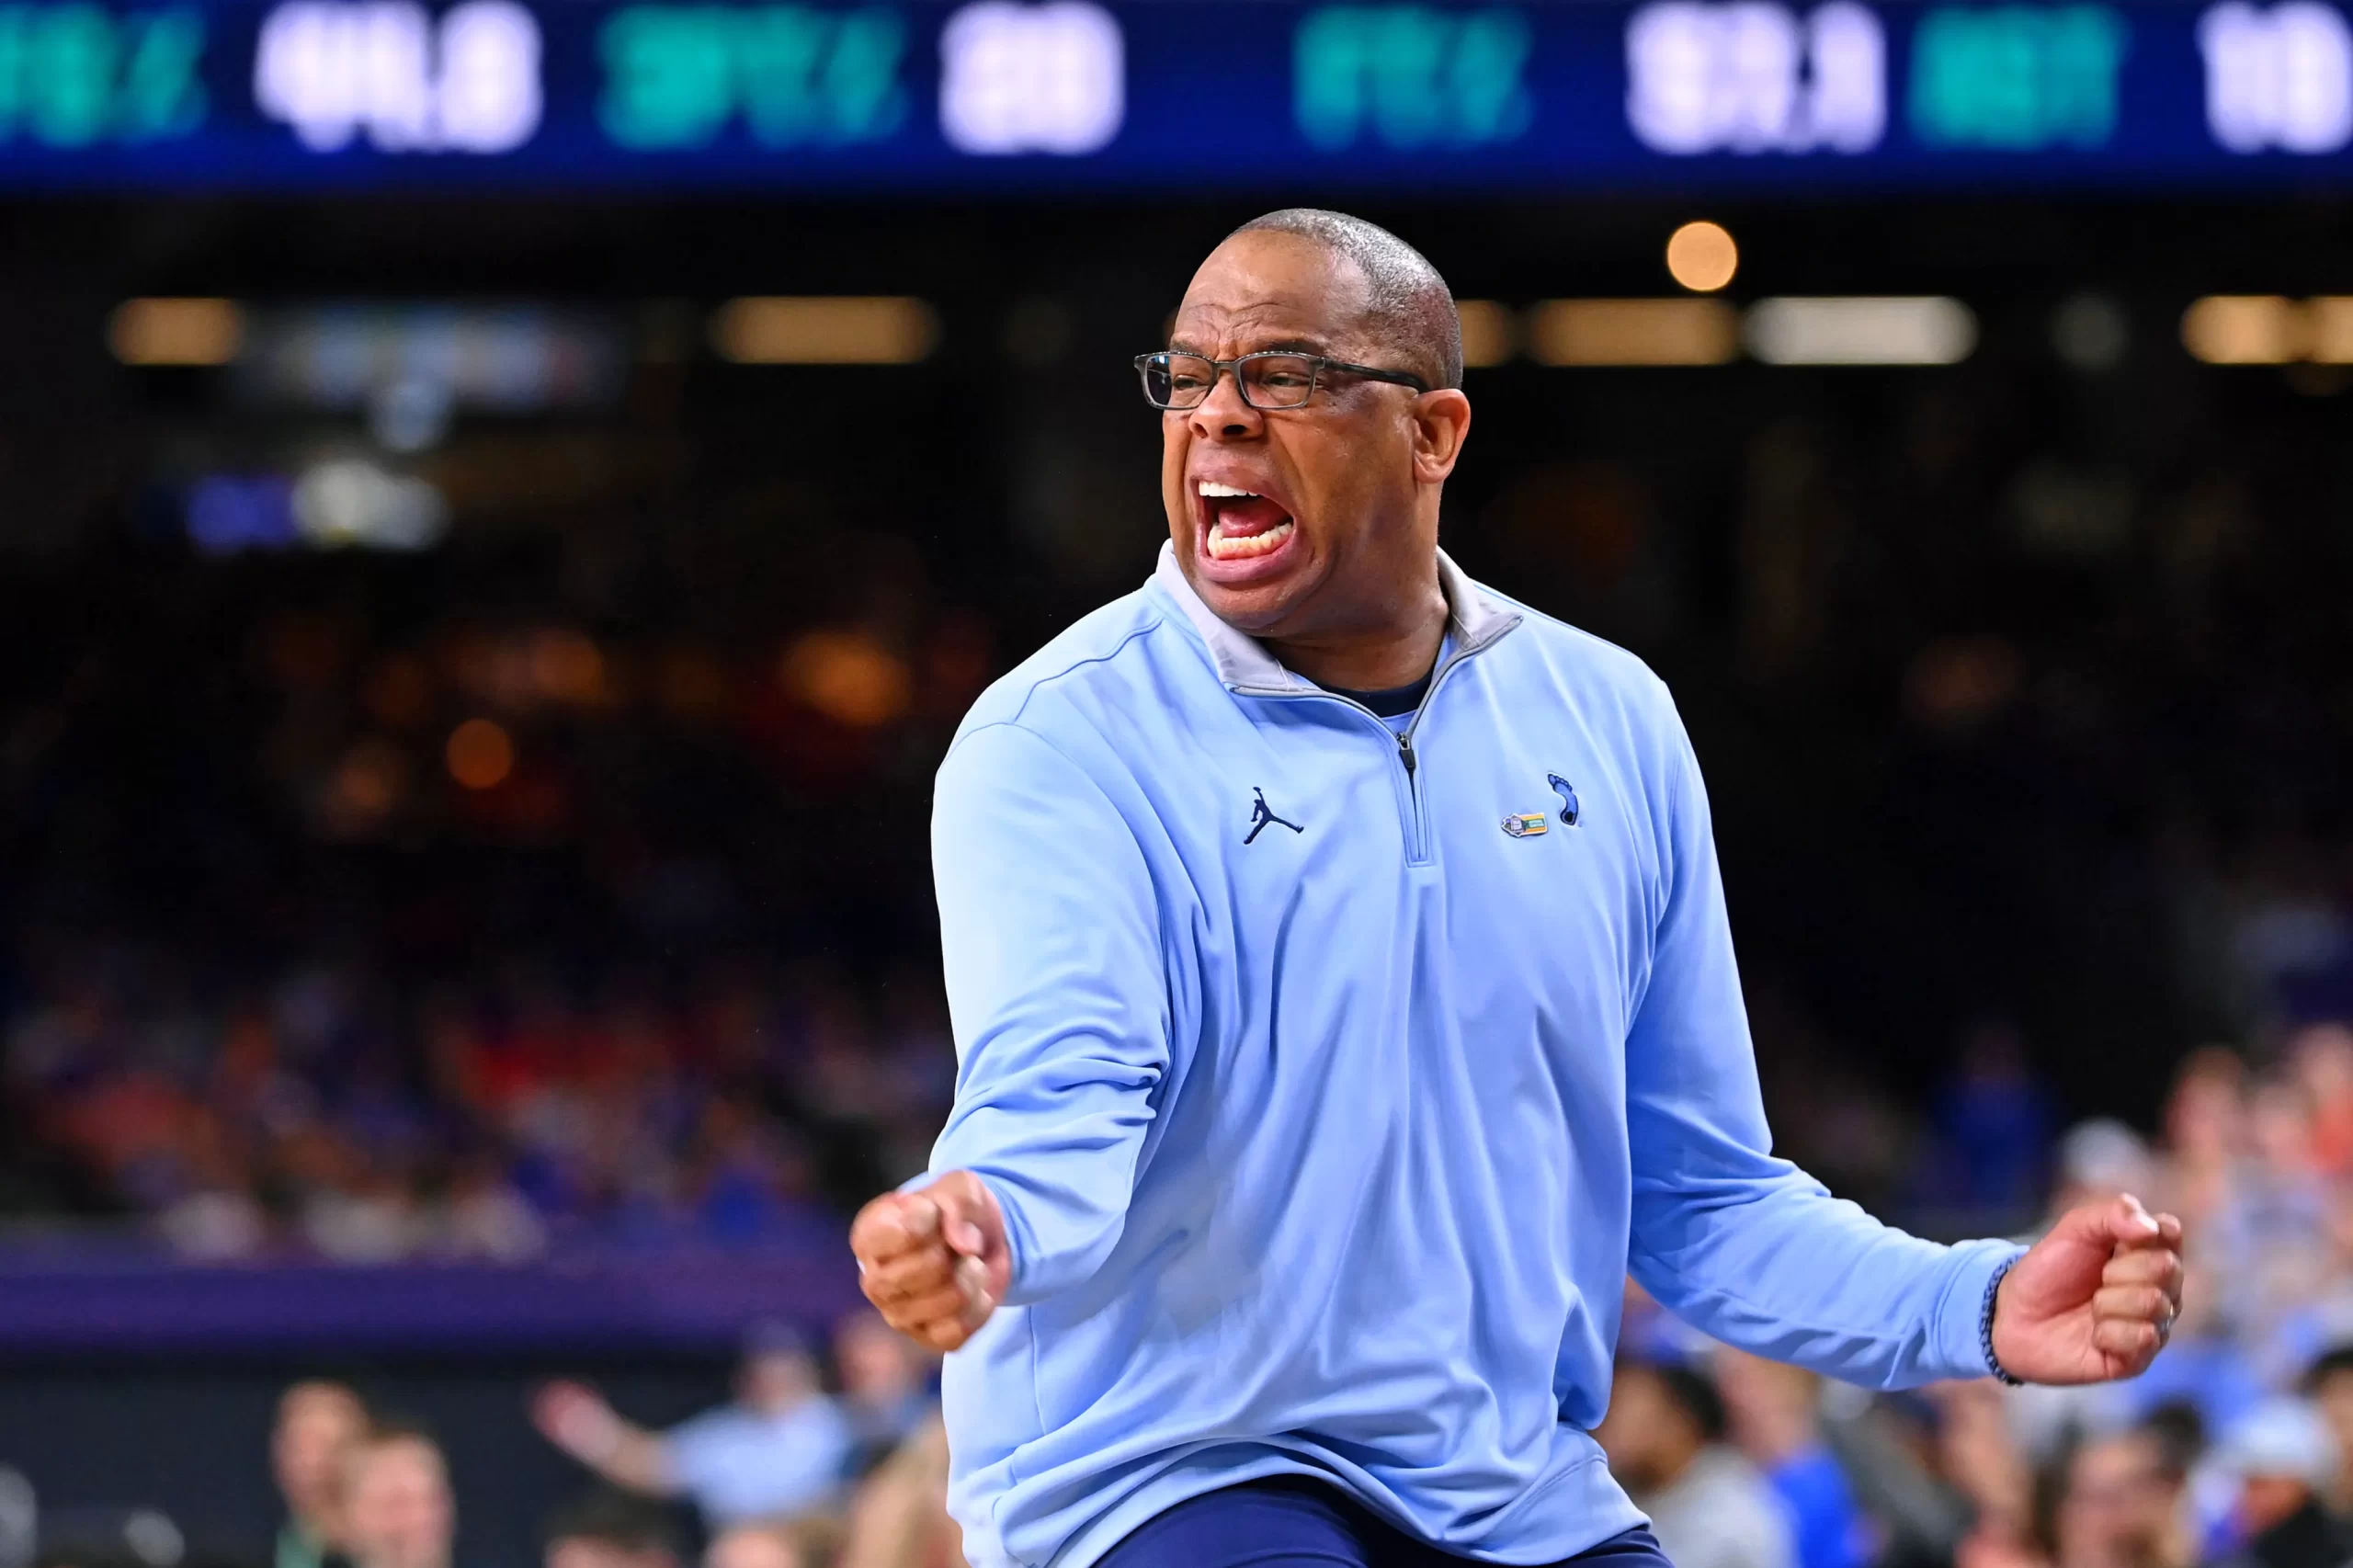
Almost as important as the players on the court, the coach is a critical pillar in NCAA coaching success. Bart Torvik provides a great resource, laying out some key metrics from the March Madness, dating back to 2000 – which can also be tailored to head coaches.
Two important metrics here are PASE (Performance Against Seed Expectation) and PAKE (Performance Against Kenpom Efficiency). PAKE is “tourney wins versus the amount of tourney wins expected based on team’s adjusted efficiency rating”, while PASE is the same think except it uses “seed expectations as the baseline, meaning it’s wins versus the amount expected for a given seed.”
Again, apply this to whatever teams you are specifically interested in, however, I’ll list some of the coaches stats I looked at when considering the impact they may have on their team during the tournament.
Since 2015 (out of 209 coaches) PAKE, PASE:
- Hubert Davis (North Carolina): 3.8, 4.3 (9th)
- Bill Self (Kansas): 2.8, -2.2 (16th)
- Dan Hurley (Uconn): 1.8, 2.9 (23rd)
- Greg McDermott (Creighton): 1, 1.4 (32nd)
- Kelvin Sampson (Houston): 0.3, 2.3 (57th)
- TJ Otzelberger (Iowa State): -0.2, -0.2 (128th)
- Tommy Lloyd (Arizona): -2.3, -3.6 (202nd)
- Matt Painter (Purdue): -4.4, -3.4 (206th)
- Rick Barnes (Tennessee): -4.8, -3.4 (207th)
- Scott Drew (Baylor): -1.2, -2.9 (179th)
- Shaka Smart (Marquette): -5.2, -6.4 (208th)
3PT% Allowed To Opposition
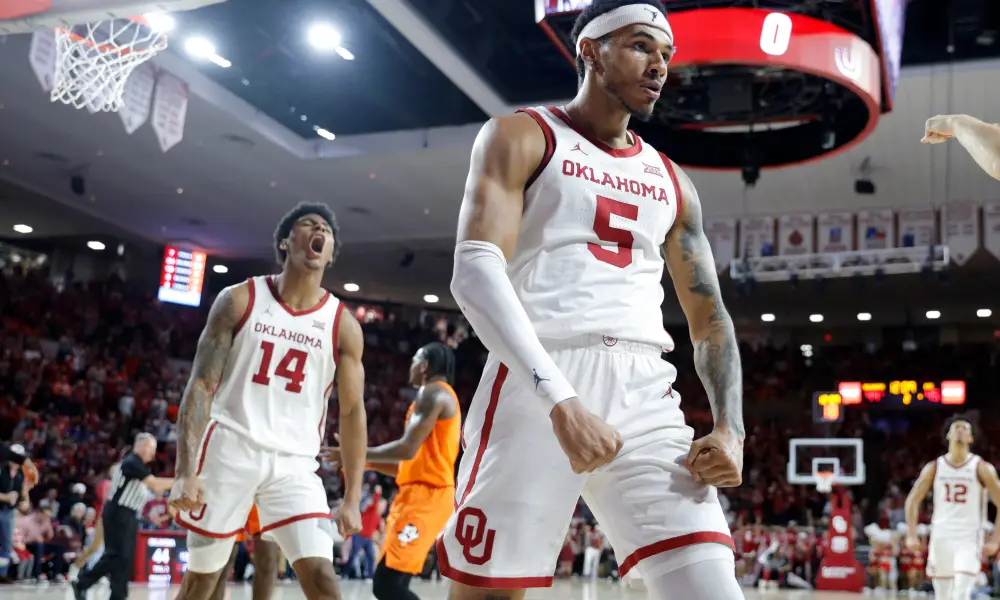
Not going to touch on this one too much, but it’s rather self explanatory. The three ball is often heavily relied upon and can ignite offences to go on heavy scoring runs almost instantly. Being able to limit these to type of looks to opposition is important.
- Oklahoma: 29% (10th)
- Auburn (29.6%) (14th)
- North Carolina (29.9%) (19th)
- Houston (30.1%) (25th)
- Tennessee (30.7%) (38th)
- UConn (31.6%) (64th)
- Kentucky (32%) (86th)
- Alabama (32%) (88th)
- TCU (32%) (94th)
- Creighton (32.2%) (100th)
- Purdue (32.3%) (108th)
Kill Shot Percentage
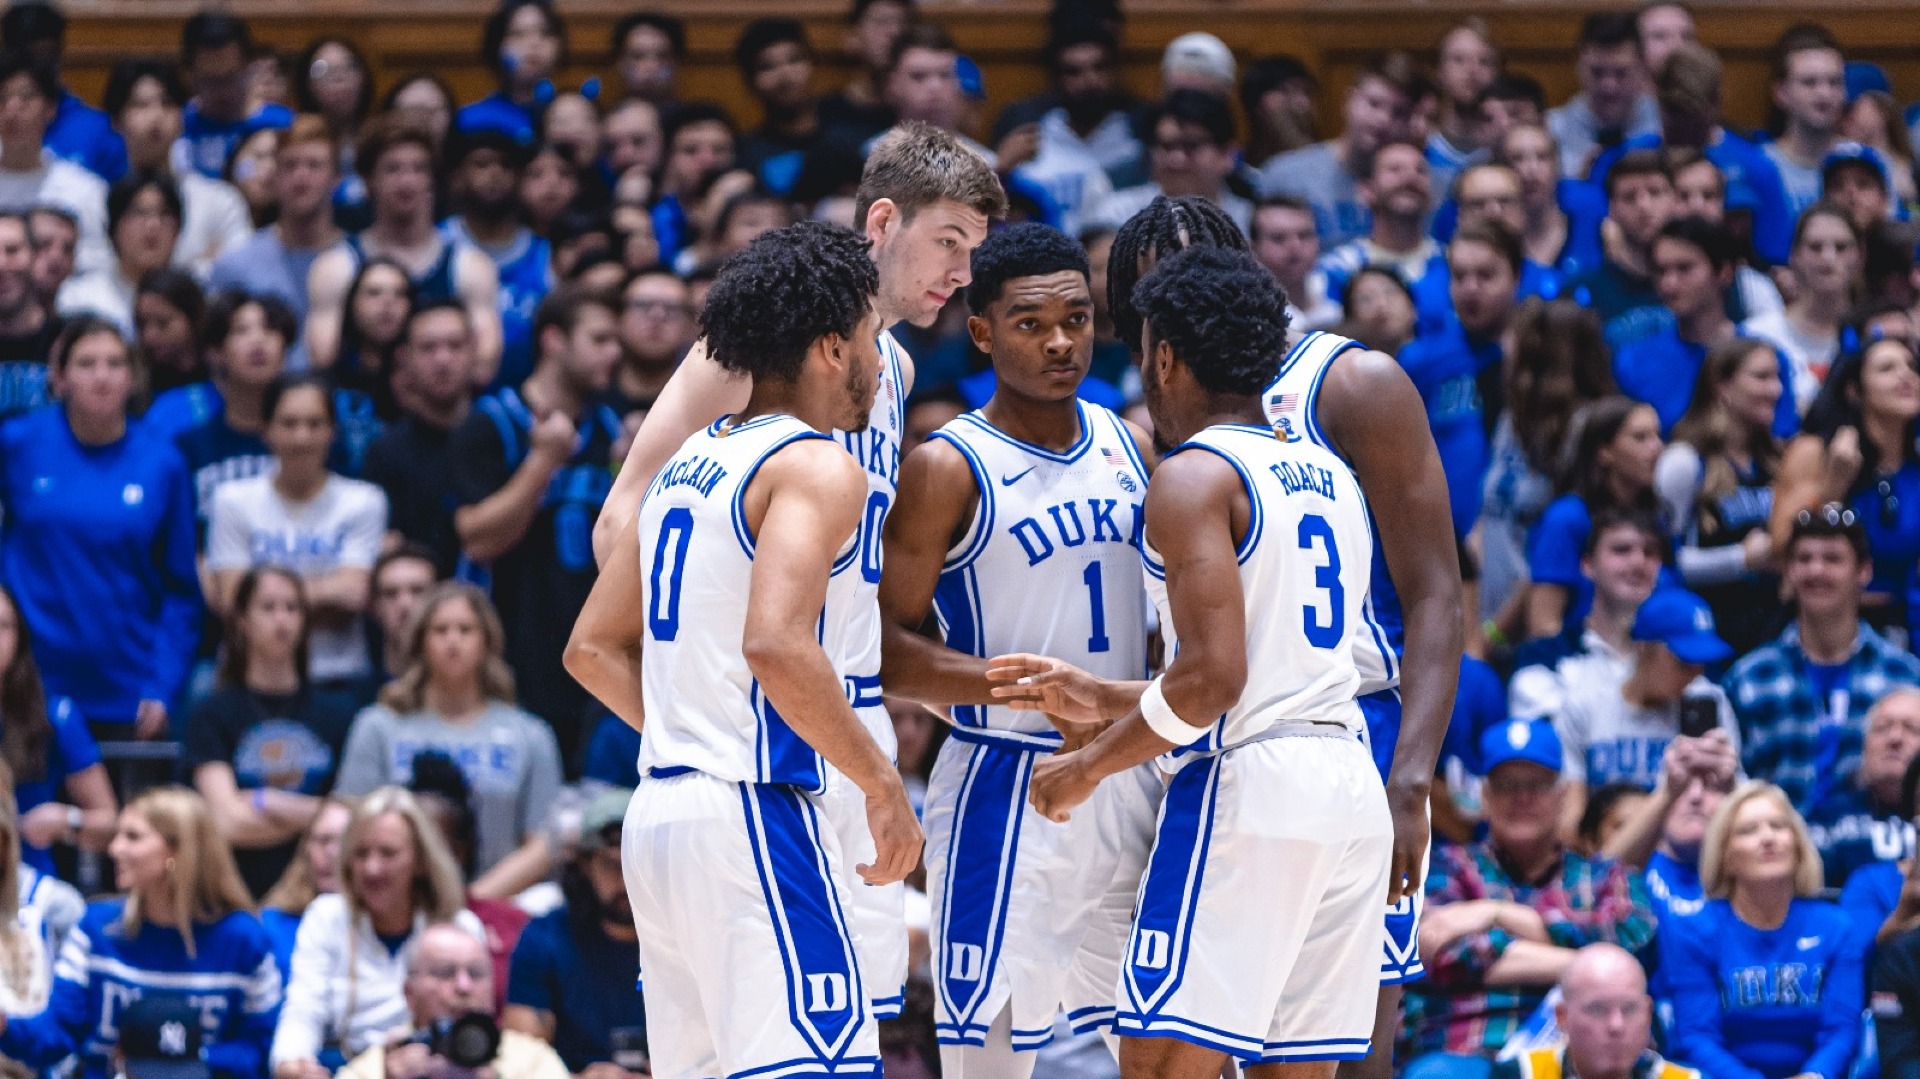
The “Kill Shot” metric, developed by Evan Miyakawa (@evanmiyq), tracks double digit scoring runs in games (10-0 or better) over the course of the season.
Why does this matter?
– A team with at least one 10-0 run wins 71% of the time
– A team with more Kill Shots than the opponent wins 81% of the time
– A team with 2 Kill Shots in a game wins 88% of the time
– A 15-0 run wins 86% of the time
– A 20-0 run wins 91%
Overall, the notable teams with most kill shots per game include:
- Houston (1st)
- St Mary’s (3rd)
- UConn (6th)
- Arizona (8th)
- North Carolina (10th)
- Iowa State (11th)
- Alabama (13th)
- Creighton (20th)
- Purdue (25th)
Conversely, the notable teams kill shots conceded per game:
- Utah (least)
- Houston (14th least)
- Tennessee (15th least)
- Duke (16th least)
- Purdue (24th least)
- Creighton (25th least)
- Arizona (26th least)
Opposition Turnovers Per Game

Similar to offensive turnovers, teams generating more opponent turnovers will garner more opportunities to convert offensive possessions into points. It can also be an indicator of a strong defence. When looking at turnovers forced per game from meaningful teams:
- Iowa State (3rd)
- Houston (12th)
- Arizona (52nd)
- Auburn (72nd)
- Tennessee (73rd)
It then steeply drops off after this.
ESPN CBPI
Another reference point which is always interesting to consider is ESPN’s College Basketball Power Index. The index is a measure of team strength that is meant to be the best predictor of performance going forward. BPI represents how many points above or below average a team is. Over the last thirteen years, ten of the eventual champions have ranked third or better in index. Currently, the top five are:
- Houston
- Purdue
- Arizona
- Alabama
- Uconn
Ultimately, this leads me to consider three teams – Houston, Arizona and North Carolina.
Steer Clear
Why have I avoided Purdue and UConn? Let’s start with Purdue. They obviously have a squad, entered around Edey who is a man mountain, will be tough for any team to stop. However, my issues primarily stem from Head Coach, Painter. Put simply, I don’t think he’s actually that great a coach and has historically underperformed despite having extremely talented teams. Since 2015, he ranks 206th out of a possible 209 coaches in Bartek (previously discussed), with a PAKE of -4.4 and a PASE of -3.4. If you extend this metric back to 2000, he ranks 411th out of a possible 415 coaches (-4.7 PAKE, -4.6 PASE). Since 2016, they have been 5 seed or higher in every March Madness and top 3 or higher in four out of those seven appearances. This is how its ended up for them:
- 2016: 5th Seed – Lost in the first round to #12 Little Rock
- 2017: 4th Seed – Lost in third round to #1 Kansas
- 2018: 2nd Seed – Lost in third round to #3 Texas Tech
- 2019: 3rd Seed – Lost in fourth round to #1 Virginia
- 2021: 4th Seed – Lost in first round to #13 North Texas
- 2022: 3rd Seed – Lost in third round to #15 St Peters
- 2023: 1st Seed – Lost in first round to #16 Fairleigh Dickinson
UConn are a more interesting case. They are currently sitting on a 25-3 record and are coming off a championship from last year. I have tailored this list based on previous requirements, which ended up omitting them within the first stage given the week 6 rankings consideration. They lost Andre Jackson, Jordan Hawkins and Adama Sanogo to the NBA, however, already have players up again for 2024 draft considerations in Donovan Clingan and Stephon Castle. As the favourite they deserve heavy consideration, but backing up another title chase will be a tough ask and at $6 or +500 odds, I just don’t think the value is there.
Who Wins?
At a quick glimpse, Houston have the best CBPI and are a well balanced team on both ends of the floor, particularly the defensive side. What I like about them the most, is from both an eye-test and data perspective they’re incredibly well rounded. Out of all the meaningful teams listed they give up the 2nd least turnovers, generate the 12th most opponent turnovers and hold opponents to the 25th lowest 3PT%. On top of that, they 1st in kill shots per game, concede the 14th least kill shots per game and make up the majority of the best three man lineups. If one thing stops them this year, it will be their offence faltering when it matters. Houston are currently the team I have bet on myself.
Arizona are third in CBPI and are quite possibly the most balanced team on the list, ranking 6th in ADJO and 11th in ADJD. They also create the 52nd most opponent turnovers of the meaningful teams, while in turn limiting their own turnovers (52nd least). Similar to Houston, they also rank well in the Kill Shot Metric (8th). Caleb Love has also been on a tear this season and more often than not, a March Madness winner will have an elite guard on the squad. The one thing I don’t like about them is their coach. Lloyd ranks really poorly in both PAKE and PASE, placing him at 202 out of a possible 206 college coaches in the comparison.
North Carolina are again, like both Houston and Arizona, a balanced squad. They give up the 19th least turnovers, hold opponents to the 19th lowest 3PT% (29.9%) and rank 10th in kill shot. On top of this, they have a coach that ranks extremely well in both PASE and PAKE. Hubert Davis has PAKE of 3.8 and PASE of 4.3, which ranks him 9th amongst 209 coaches. I will preface he has only had a small sample size as a HC, winning the tournament in his first year, before not even qualifying his second, so this metric is far less valuable, however, does attest to the fact he knows what it takes to win in the tournament.
Who could be this years dark horse?
Iowa State are the team that immediately jump out at me. While currently having an ADJO ranked 52nd, their defence is elite, posting the 2nd best ADJD. They create a ton of pressure on opposition offences, especially the ball handlers, forcing the 2nd most turnovers in the NCAA. This gives them more offensive opportunities, reflected in the fact they have the 11th best ranking in Kill Shot metrics. Lastly, as previously mentioned, both Houston and Iowa State account for the majority of the top 100 three man lineups in terms of Adjusted Team Efficiency Margin. A strong defence that generates a lot of turnovers will be an especially tricky matchup for any squad that faces them during the tournament. At $51 (+5000) they are definitely worth a sprinkle.

